国の鉄道利用順リスト

| 鉄道輸送 |
|---|
 |
|
|
| 鉄道施設 |
|
|
| 車両とサービス |
|
|
| 特殊線 |
|
|
| その他 |
 交通ポータル |
国の鉄道利用順リスト(くにのてつどうりようじゅんリスト)では、国際鉄道連合(UIC)やその他の資料に基づいて、世界各国の鉄道利用度合いの順序での一覧を示す。
旅客鉄道
旅客キロ数
国際鉄道連合(UIC)データに基づく、人キロ換算による上位国を示す。
| 順位 | 国 | 10億人キロ | 統計年 |
|---|---|---|---|
| 1 |  中国 |
1,550[1] | 2019 |
| 2 |  インド |
1,157[2] | 2019 |
| 3 |  日本 |
446.7[3] | 2019 |
| 4 |  ロシア |
133.6[3] | 2019 |
| 5 |  フランス |
112.6[3] | 2019 |
| 6 |  ドイツ |
100[3] | 2019 |
| 7 |  韓国 |
93.9[3] | 2019 |
| 8 |  イギリス |
80.5[3] | 2018 |
| 9 |  イタリア |
56.6[3] | 2019 |
| 10 |  アメリカ |
32.5[3] | 2019 |
| 11 |  ウクライナ |
28.4 | 2019 |
| 12 |  スペイン |
27.3[3] | 2019 |
| 13 |  オランダ |
22.6[3] | 2018 |
| 14 |  ポーランド |
22.1[3] | 2019 |
| 15 |  スイス |
21.7[4] | 2019 |
| 16 |  パキスタン |
20.3 | 2015 |
| 17 |  台湾 |
19.8 | 2015 |
| 18 |  インドネシア |
18.5 | 2015 |
| 19 |  カザフスタン |
18.5[3] | 2018 |
| 20 |  オーストラリア |
17.6[3] | 2018 |
| 21 |  イラン |
16.3 | 2014 |
| 22 |  スウェーデン |
14.6[3] | 2019 |
| 23 |  トルコ |
14.3[3] | 2019 |
| 24 |  バングラデシュ |
14.3[5] | 2019 |
| 25 |  オーストリア |
13.4[3] | 2019 |
| 26 |  チェコ |
10.9[3] | 2019 |
| 27 |  ベルギー |
10.2[3] | 2017 |
| 28 |  アルゼンチン |
8.4[3] | 2017 |
| 29 |  ハンガリー |
7.8[3] | 2019 |
| 30 |  タイ |
7.5 | 2011 |
| 31 |  デンマーク |
6.6[3] | 2018 |
| 32 |  ベラルーシ |
6.3[3] | 2019 |
| 33 |  ルーマニア |
5.9[3] | 2019 |
| 34 |  ポルトガル |
5[3] | 2019 |
| 35 |  フィンランド |
4.9[3] | 2019 |
| World | 2,954 | 2014 | |
 欧州連合 |
416 | 2019 |
年間旅客輸送人数
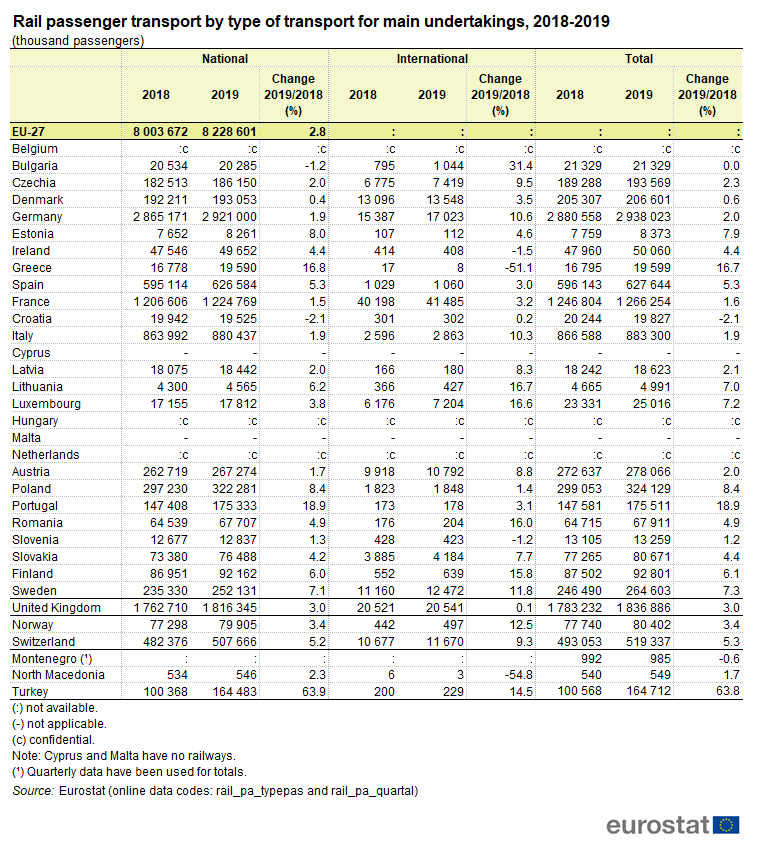
国際鉄道連合(UIC)データに基づく、輸送人員数の上位国を示す。
| 順位 | 国 | 百万人 | 統計年 |
|---|---|---|---|
| 1 | 日本 |
25,201 | 2019 [6] |
| 2 | インド |
8,439 | 2019 |
| 3 | 中国 |
3,660 | 2019[7] |
| 4 | ドイツ |
2,938 | 2019[8] |
| 5 |  ブラジル |
2,480 | 2023[9] |
| 6 | フランス |
1,880 | 2019[10] |
| 7 | イギリス |
1,836.8 | 2019[8] |
| 8 | ロシア |
1,157.2 | 2018 |
| 9 | オーストラリア |
1,064.2 | 2018–19 |
| 10 | イタリア |
883.3 | 2019[8] |
| 11 | スペイン |
636 | 2019[11] |
| 12 | アメリカ |
535 | 2019 |
| 13 | スイス |
519.3 | 2019[8] |
| 14 | オランダ |
474.5 | 2019 |
| 15 | ウクライナ |
440.9 | 2016[12] |
| 16 | インドネシア |
429.2 | 2019[13] |
| 17 | アルゼンチン |
426.2 | 2018 |
| 18 | ポーランド |
324.1 | 2019[8] |
| 19 | 台湾 |
291.84 | 2018 |
| 20 | オーストリア |
278 | 2019[8] |
| 21 |  エジプト |
270 | 2019[14] |
| 22 |  南アフリカ |
269 | 2017–18[15] |
| 23 | スウェーデン |
264.6 | 2019[8] |
| 24 | ベルギー |
246.94 | 2018 |
| 25 | デンマーク |
206.6 | 2019[8] |
| 26 | チェコ |
193.5 | 2019[8] |
| 27 | ポルトガル |
175.5 | 2019[8] |
| 28 | トルコ |
164.7 | 2019[8] |
| 29 |  スリランカ |
138.66 | 2017 [16] |
| 30 | 韓国 |
127.84 | 2018 |
| 31 | ハンガリー |
119 | 2018 |
| 32 |  カナダ |
106.9 | 2019[17] |
| 33 | フィンランド |
92.8 | 2019[18] |
| 34 | バングラデシュ |
92.71 | 2019[5] |
| 35 |  ノルウェー |
80.402 | 2019[19] |
| 36 |  スロバキア |
80 | 2019[8] |
| 37 | ベラルーシ |
79.86 | 2018 |
| 38 | ルーマニア |
67.9 | 2019[8] |
| 39 |  イスラエル |
64.6 | 2017 |
| 40 |  メキシコ |
57 | 2018 |
| 41 | パキスタン |
52.39 | 2018 |
| 42 |  アイルランド |
50.06 | 2019[8] |
| 43 | タイ |
50 | 2017[20] |
| 44 |  ミャンマー |
48 | 2017[21] |
| 45 |  チリ |
47 | 2018[22] |
| 46 |  マレーシア |
44.51 | 2018 |
| 47 |  チュニジア |
41 | 2017 |
| 48 |  アルジェリア |
39 | 2018 |
| 49 |  モロッコ |
35 | 2018 |
| 50 |  ニュージーランド |
35 | 2019[23] |
| 51 | イラン |
28.09 | 2018 |
| 52 |  ルクセンブルク |
25 | 2019[8] |
| 53 | カザフスタン |
22.9 | 2018 |
| 54 |  フィリピン |
21.84 | 2018 |
| 55 |  ウズベキスタン |
21.59 | 2018 |
| 56 |  ブルガリア |
21.3 | 2019[8] |
人口あたりの旅客キロ
| 国 | 年間キロ | 年度 |
|---|---|---|
| スイス |
1,637 | 2021[24] |
| フランス |
1,040 | 2021[24] |
| オーストリア |
950 | 2021[24] |
| スウェーデン |
768 | 2021[24] |
| デンマーク |
722 | 2021[24] |
| ドイツ |
697 | 2021[24] |
| ベルギー |
653 | 2021[24] |
| チェコ |
637 | 2021[24] |
| オランダ |
570 | 2021[24] |
| ハンガリー |
552 | 2021[24] |
| イギリス |
460 | 2021[24] |
| イタリア |
457 | 2021[24] |
| ポーランド |
417 | 2021[24] |
| スペイン |
348 | 2021[24] |
| ルーマニア |
220 | 2021[24] |
 クロアチア |
139 | 2021[24] |
| 日本 |
3,400 | 2016[25][26] |
| ロシア |
1,220 | |
| インド |
1,178 | 2017[27] |
| ウクライナ |
1,150 | |
| ベラルーシ |
1,030 | |
| 中国 |
1,019 | 2019 |
| カザフスタン |
880 | |
| 韓国 |
650 | |
| エジプト |
550 | |
| 台湾 |
410 | |
| イラン |
180 | |
| アルゼンチン |
170 | |
| パキスタン |
160 | |
| タイ |
150 | |
| インドネシア |
110 | |
| バングラデシュ |
86.6 | 2019 |
| トルコ |
80 | |
| アメリカ |
80 |
輸送シェア
主要国における地下鉄を除いた鉄道の、交通機関全体に占める輸送シェアを示す。
| 国 | 輸送シェア(%) | 年 |
|---|---|---|
 日本 | 27 | 2000[28] |
 スイス | 16.4 | 2006[29] |
| ハンガリー | 12.6 | 2006[29] |
| オーストリア | 9.8 | 2006[29] |
| ルーマニア | 9.3 | 2006[29] |
 フランス | 9.2 | 2006[29] |
| デンマーク | 9.0 | 2006[29] |
 オランダ | 8.3 | 2006[29] |
| スウェーデン | 8.2 | 2006[29] |
 ドイツ | 7.7 | 2006[29] |
 ベルギー | 6.9 | 2006[29] |
| チェコ | 6.9 | 2006[29] |
 ポーランド | 6.7 | 2006[29] |
 インドネシア | 6.3 | 2005[30] |
 スロバキア | 5.9 | 2006[29] |
 イギリス | 5.9 | 2006[29] |
 イタリア | 5.5 | 2006[29] |
| ブルガリア | 5.4 | 2006[29] |
 スペイン | 5.3 | 2006[29] |
 アイルランド | 5.1 | 2006[29] |
 ラトビア | 5.1 | 2006[29] |
| フィンランド | 4.9 | 2006[29] |
| ノルウェー | 4.5 | 2006[29] |
 ポルトガル | 4.4 | 2006[29] |
 クロアチア | 4.4 | 2006[29] |
 ルクセンブルク | 3.9 | 2006[29] |
 スロベニア | 3.2 | 2006[29] |
 トルコ | 2.5 | 2006[29] |
 エストニア | 1.7 | 2006[29] |
 北マケドニア | 1.7 | 2006[29] |
 ギリシャ | 1.6 | 2006[29] |
 リトアニア | 1.0 | 2006[29] |
 アメリカ合衆国 | 0.3 | 2004[29] |
この表に示した数値は、その国の鉄道利用の傾向だけではなく、その国の国土の特徴も反映している。例えば、イギリスでは比較的小さな国土に多くの人口があり、アメリカ合衆国のように広大な国土にまばらに人が住んでいる国に比べると頻繁に短距離の旅行が行われる。その国における鉄道旅客輸送の実際の重要性を考えるには、旅行回数を考える必要がある。都市間輸送に限定して考えれば、アメリカ合衆国の1人あたり年間鉄道利用回数はほとんど測定不可能なほど小さい。アメリカ合衆国では年間1人あたり0.08回であるのに対してイギリスでは17.54回で、イギリス人はアメリカ人より219倍鉄道を利用することになる。ただし、アメリカの数値はアムトラックだけを数えており、通勤輸送を数えていない。通勤輸送を含めるとアメリカの数値は1.3回となり、さらに地下鉄を含めるとアメリカは10回程度、イギリスは30回程度となる。また、ドイツのように近郊輸送を合計の鉄道輸送に含めている国もあれば、イギリスのように含めていない国もある。詳細は出典とした国際鉄道連合の資料を参照。
貨物鉄道
「鉄道貨物輸送」も参照
年間貨物輸送量

100億トンキロ以上の輸送量がある国を示す。
| 国 | 10億トンキロ | 年 |
|---|---|---|
 中国 |
2,947[31] | 2011 |
| アメリカ合衆国 |
2,773[32] | 2008 |
 ロシア |
1,865 | 2009 |
 インド |
551 | 2009 |
 欧州連合 |
277 | 2009 |
 ブラジル |
268 | 2008 |
 カナダ |
258 | 2009 |
 カザフスタン |
197 | 2009 |
| ウクライナ |
196 | 2009 |
 南アフリカ共和国 |
113 | 2008 |
| ドイツ |
93.9 | 2009 |
 オーストラリア |
62.1 | 2009 |
 メキシコ |
54.4 | 2004 |
| ベラルーシ |
42.7 | 2009 |
| ポーランド |
29.9 | 2009 |
| フランス |
26.5 | 2009 |
 ウズベキスタン |
24.2 | 2009 |
| イギリス |
22.2 | 2006 |
| 日本 |
22.1 | 2008 |
 イラン |
20.5 | 2008 |
| オーストリア |
20.2 | 2009 |
| ラトビア |
18.7 | 2009 |
| イタリア |
13.6 | 2009 |
| スイス |
12.5 | 2009 |
 アルゼンチン |
12.0 | 2008 |
| リトアニア |
11.9 | 2009 |
| スウェーデン |
11.5 | 2006 |
 トルクメニスタン |
11.5 | 2008 |
| チェコ |
11.2 | 2009 |
| エストニア |
10.2 | 2006 |
出典: UIC database
年間貨物輸送トン
1億トン以上の輸送トンがある国を示す。
| 国 | 百万トン | 年 |
|---|---|---|
| 中国 |
3,930[33] | 2011 |
| アメリカ合衆国 |
1,820 | 2007 |
| ロシア |
1,108 | 2009 |
| インド |
794 | 2008 |
| ブラジル |
460 | 2008 |
| ウクライナ |
392 | 2009 |
| ドイツ |
341 | 2009 |
| カナダ |
258 | 2009 |
| オーストラリア |
248 | 2009 |
| カザフスタン |
248 | 2009 |
| 南アフリカ共和国 |
181 | 2005 |
| ベラルーシ |
134 | 2009 |
| ポーランド |
110 | 2009 |
| イギリス |
110 | 2006 |
| オーストリア |
106 | 2009 |
出典: UIC database
貨物輸送シェア(全交通機関中)
| 国 | シェア(パーセント) | 年 |
|---|---|---|
| ロシア | 65 | 2006[29] |
| アメリカ合衆国 | 42 | 2006[29] |
| スウェーデン | 30 | 2006[29] |
| 中国 | 58 | 2006[29] |
| 日本 | 20 | 2000[28] |
人口当たり年間貨物輸送量
| 国 | 人口当たり輸送トンキロ |
|---|---|
| ロシア |
12,599 |
| カナダ |
10,517 |
| アメリカ合衆国 |
9,165 |
| オーストラリア |
2,308 |
| 中国 |
2,187 |
| スイス |
1,670 |
| ドイツ |
1,060 |
| 欧州連合 |
782 |
脚注
- ↑ “2019 年铁道统计公报”. www.mot.gov.cn. 2024年10月7日閲覧。
- ↑ “Railway Statistics Synopsis 2020 (Statistics for 2019)”. International Union of Railways. 2020年8月8日時点のオリジナルよりアーカイブ。2024年10月7日閲覧。
- 1 2 3 4 5 6 7 8 9 10 11 12 13 14 15 16 17 18 19 20 21 22 23 24 25 “Transport - Passenger transport - OECD Data” (英語). OECD. 2020年1月閲覧。
- ↑ “Leistungen im Personenverkehr”. 2020年1月閲覧。
- 1 2 Information Book (2020 ed.). Dhaka: Bangladesh Railway. (2020)
- ↑ 『旅客輸送量の推移』(レポート)国土交通省、2021年。
- ↑ (Chinese) 2019 年铁道统计公报 - 2019 Railway statistical bulletin
- 1 2 3 4 5 6 7 8 9 10 11 12 13 14 15 16 “Rail passenger transport by type of transport for main undertakings, 2018-2019 (thousand passengers)”. ec.europa.eu. 24 September 2021閲覧。
- ↑ “Balanço do setor ferroviário”. 2024年10月7日閲覧。
- ↑ “bilan-ferroviaire-2019.pdf - Autorité de Régulation des Transports”. www.autorite-transports.fr. 26 January 2022閲覧。
- ↑ “Los usuarios de avión suben un 6,4% en 2019 y los del AVE aumentan un 4,9%” (スペイン語). (11 February 2020) 13 April 2020閲覧。
- ↑ “Ukraine railways statistics - Ministry of Infrastructure of Ukraine”. mtu.gov.ua. 22 September 2021閲覧。
- ↑ “Indonesia's Railway Renaissance - The Diplomat”. The Diplomat (19 January 2022). 26 January 2022閲覧。
- ↑ “Egypt moves to stop the bleeding on dilapidated rail network”. www.arabnews.com (21 April 2021). 25 April 2021閲覧。
- ↑ “Deliberate train fires cost South African rail service $42.5 mln”. Reuters (9 October 2019). 9 October 2018時点のオリジナルよりアーカイブ。3 December 2019閲覧。
- ↑ “Performance Report - 2017 Department of Sri Lanka Railways”. www.railway.gov.lk. 2024年10月7日閲覧。
- ↑ “Canada's Passenger Railways: Moving People”. www.railcan.ca (6 October 2016). 2 December 2019閲覧。
- ↑ “Growth continued in passenger traffic by rail in Finland in 2019”. Statistics Finland (27 August 2020). 9 January 2021閲覧。
- ↑ “Passenger transport by rail” (ノルウェー語). Ssb.no (2018年12月10日). 2019年3月1日閲覧。
- ↑ “50 Years of Reliable Rail in Thailand”. GE Report
- ↑ “Railway rider numbers grow after management revamp”. Myanmar Times (20 February 2018). 3 December 2019閲覧。
- ↑ “The renaissance of the train in Chile”. Chile Today (10 January 2019). 24 April 2019閲覧。
- ↑ “KiwiRail Annual Integrated Report 2019”. KiwiRail (2019年). 2 December 2019閲覧。
- 1 2 3 4 5 6 7 8 9 10 11 12 13 14 15 16 “IRG rail Market Monitoring”. 2024年10月7日閲覧。
- ↑ “Statistical handbook of Japan”. stat.go.jp (2018年). 2019年9月26日閲覧。
- ↑ “Road Bureau - MLIT Ministry of Land, Infrastructure, Transport and Tourism”. 2019年1月閲覧。
- ↑ “Indian Railways Yearbook 2018-19”. 2020年1月閲覧。
- 1 2 “Transportation by Railway”. 東日本旅客鉄道(JR東日本). 2008年7月5日閲覧。
- 1 2 3 4 5 6 7 8 9 10 11 12 13 14 15 16 17 18 19 20 21 22 23 24 25 26 27 28 29 30 31 32 33 34 35 “EU Transport in Figures; Statistical Pocketbook”. European Commission Directorate-General for Energy and Transport; Eurostat (2007年). 2008年6月1日時点のオリジナルよりアーカイブ。2008年7月5日閲覧。
- ↑ “High Speed Train Project in Indonesia (Jakarta - Surabaya corridor)” (PDF). Ministry of Transportation. 2011年6月14日時点のオリジナルよりアーカイブ。2011年6月2日閲覧。
- ↑ http://www.china-mor.gov.cn/zwzc/tjxx/zyzb/201102/t20110212_8115.html
- ↑ “UIC world rail statistics for 2008”. UIC database (2008年). 2011年6月2日閲覧。
- ↑ http://www.stats.gov.cn/tjgb/ndtjgb/qgndtjgb/t20120222_402786440.htm